Although it is possible today to fully bundle all key figures generated in warehouse and distribution systems, the complex nature of such facilities makes this difficult. However, it is possible to compare different key figures in a meaningful way using a predefined system of key figures, thus generating an “organized set of key figures”. The aim of such a system is to provide clear and informative facts about the individual processes and the associated objectives.
A key figure system is used in the management and controlling of logistics systems. The figures calculated in it, usually from raw data, represent a significant process overview for the employee. A distinction is made between verifiable properties (performance) and a comparable evaluation (benchmarking) (see operationalization of logistics objectives).
A system of key figures is generally understood to mean a compilation of quantitative variables in which the individual key figures are related to each other in a meaningful way, complement or explain each other, and are geared towards a common overarching goal.
Thomas Reichmann, 5th edition, page 23, 2011, Viewer+Teubner
Functions of key figure systems
A key figure system fulfills various functions:
- Information function
- Analysis function
- Control function
- Documentation function
Key figure system in distribution centers
How could a consistent key figure system for internal logistics in a distribution center be constructed? This question was addressed by Dipl.-Ing. K. Heptner and the following graphic was developed, which is based on three overarching key figures. The first two points belong together. Note: Clicking on the graphic twice will automatically enlarge the image section.
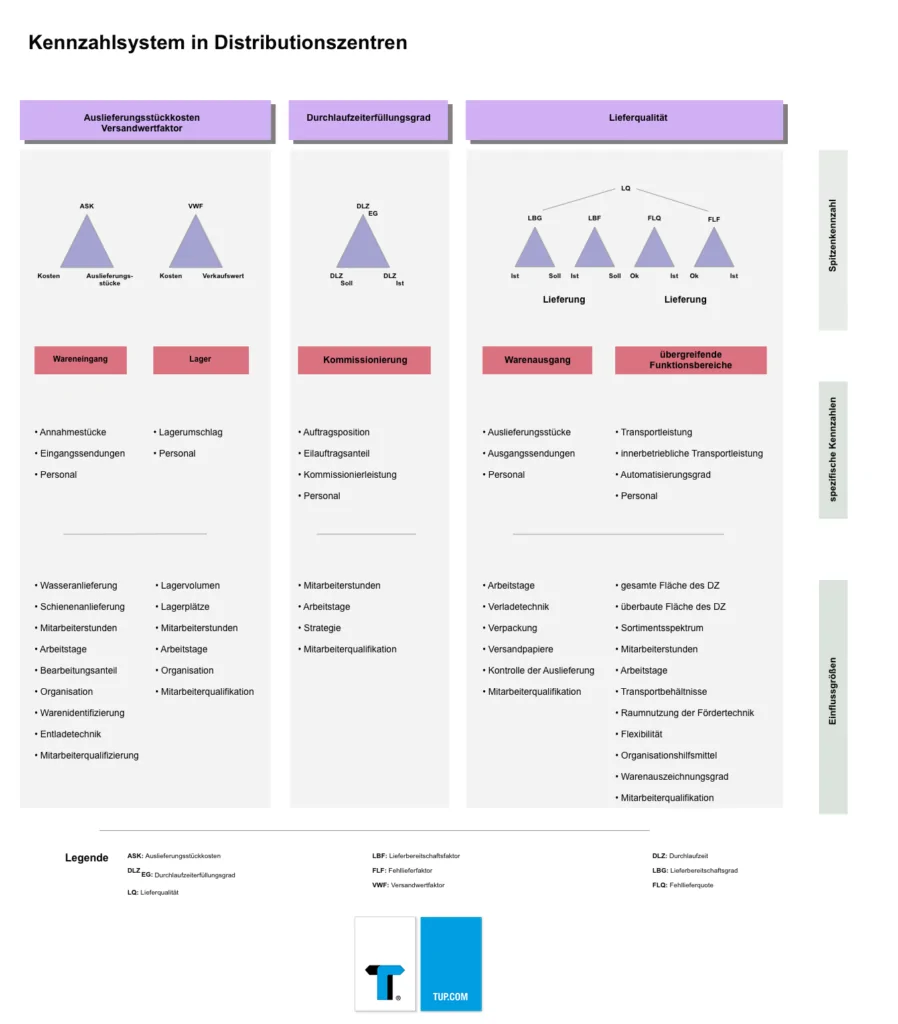
- Delivery costs: Total costs of the distribution center divided by the number of delivery items per time unit.
- Shipping value factor: Quotient of total costs and sales value of the inventory per time unit.
- Throughput time performance level: Quotient of target and actual order throughput time.
- Delivery quality: Function (illustration) of service level and delivery performance as well as error delivery rate and error delivery factor (see also perfect order fulfillment).
A similar approach is taken by VDI guideline 4400, sheet 3. It assumes the following illustration or goals of a key performance indicator system:
- High logistics efficiency (overall picture)
- High logistics performance (short throughput times, high productivity, high delivery service)
- Low logistics costs (low inventory costs, low process costs)
Operationalization of logistics objectives
The key figures themselves serve to operationalize the logistics objectives. What is important here is that, in addition to the key performance indicators for measuring logistics performance and the key cost indicators for measuring logistics costs, the key figure system also contains so-called structural key figures. In the context of benchmarking studies, they are not assigned to any of the objectives.
Examples of structure key figures:
• Picking order items per operating calendar day
• Goods delivery per operating calendar day
• Transport time to customer per consignment
• Transport distance per consignment
• Shipping weight per consignment
Common classic performance measurement systems
- DuPont (ROI tree) – this performance measurement system was developed as early as 1919 and is suitable for parts of the company for which profit can also be determined. The control function is geared towards short-term potential.
- ZVEI – this is a largely industry-neutral system consisting of 88 main and 122 auxiliary key figures. In contrast to DuPont, ZVEI focuses on annual financial statements; however, long-term surveys are not planned.
- RL – the flexible system developed by Reichmann and Lachnit consists of two core elements, one of which also fulfills individual information needs and is built adaptively (special section).
Other key figure systems worth mentioning are: Managerial Control Concept and Ratios au Tableau de Bord.
In addition, there are special key figure systems in intralogistics that are individually tailored to the individual processes.
Purpose orientation of key figure systems
A key figure system has a purpose orientation that can vary depending on the intended use and function. In the case of action-oriented use, for example, changes in behavior are brought about on the basis of the information obtained.
For more information on the topic of key figures and logistics controlling, see supply chain management (SCM) and optimization using process chain management.
Teaserbild: Stern / CC BY-SA 3.0
Graphic: TUP / Template: Dipl.-Ing. K. Heptner