Big Data is a term that has accompanied us as a software manufactory for quite some time. We are not alone in this, as a quick glance at Google Trends shows. But a pile of data alone does not create added value, which requires the efficient analysis of this data. In the series of articles titled ‘Analytics’, we present these analysis methods and their added value.
The challenge of ‘Big Data’ has been a central topic in the field of optimization-driven intralogistics, and not just since 2011 with ‘Industry 4.0’. However, data recorded by ever more precise and numerous sensors is only the first step in creating operational added value from this information. The second step is the context. As a software manufactory, we see this as our core task, which we represent with our motto ‘software follows function’.
Descriptive analysis in intralogistics
The basis for all analysis processes is descriptive analysis. Its goal is to clearly present and assign empirical data. Thus, past and present states can be represented descriptively. In addition, relevant key figures must be defined to ensure readability for decision-makers.
The key figures of intralogistics
The main metrics measured in most logistics centers are figures on picks, orders, transports, registrations, inventory and counting of packages or load units.
Dimensions are applied to these metrics in the next step. Dimensions denote the characteristics of these data. The simplest dimension is time, for example, to analyze the number of picks or transports per hour or day. More complex dimensions are storage zones or clients.
The key to maximizing the added value of descriptive analysis in intralogistics is to find the combination of dimensions and metrics that provides the best possible insight into the efficiency of the company’s business processes.
Clean data as the basis for Smart Data
The difference between Big Data, which is a large amount of data from which either no conclusions or only limited conclusions can be drawn, and Smart Data is the tailored context. In order to reliably analyze and optimize business processes, only the best possible structured data can help. Another requirement is that additional measured values or objects to be measured can be easily integrated into the model.
Objects, values, dimensions and events as model basis
The basis for descriptive analysis is a data model that is as flexible as possible and at the same time structurally understandable, so that the prepared data can easily be analyzed and interpreted.
In intralogistics, an object is a process or a physical object. It can therefore be a pick, but also a storage and retrieval operation of a storage and retrieval machine. This results in values that are assigned to the object, such as its weight, its dimensions or its current position. It is important that these values are quantifiable and generally valid.
The combination of values and object shows what something is and what state it is in.
Events are instances in which data is collected or added to the object. For example, if the object is moving on a conveyor belt, its position is automatically updated as it passes sensors. During this process, dimensions can also be assigned to the object.
Dimensions are attributes of values that give them a context-based quality. To come back to the example of the object on the materials handling technology: Measured values and events make it clear where it is, what its physical dimensions are and what it is. Via dimensions, the “Why?” and “Where?” and “When?” are extended by adding, for example, an order number, the warehouse or warehouse zone, and the current shift in the warehouse as a dimension.
The advantage of this model is that a new context can be easily mapped via dimensions and that it can be applied in a wide variety of situations as long as the data is collected in a consistent way. Whether automated materials handling technology or manual picking makes no difference in the usability of the data.
OLAP cubes as configurable context memory
Data that has been enhanced with a context via events, values and dimensions is often presented in the form of an OLAP or data cube.
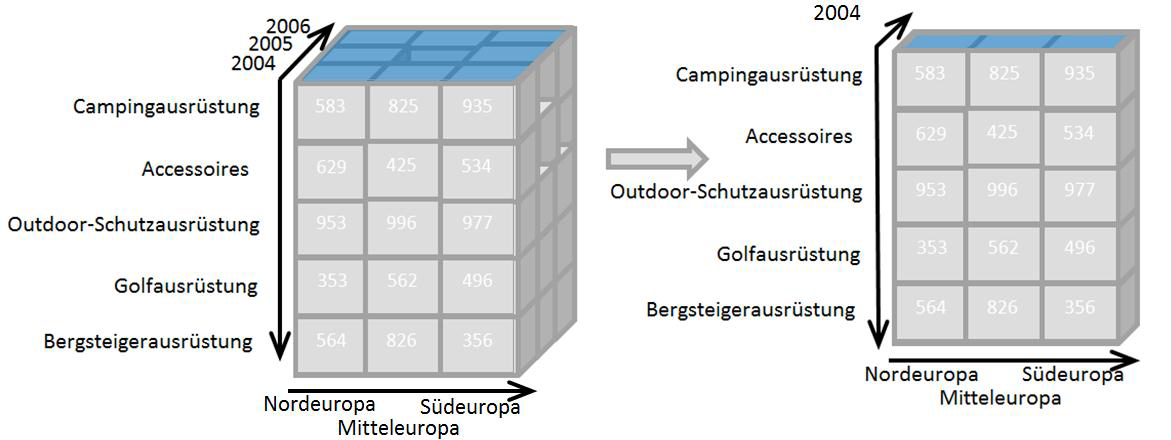
Along the axes of this cube are the dimensions, which can be reduced in their complexity or adapted to concrete application situations using various filters. The special feature of this model is that it can contain smaller variants of itself. These detailed cubes can then be accessed via a so-called drill-down.
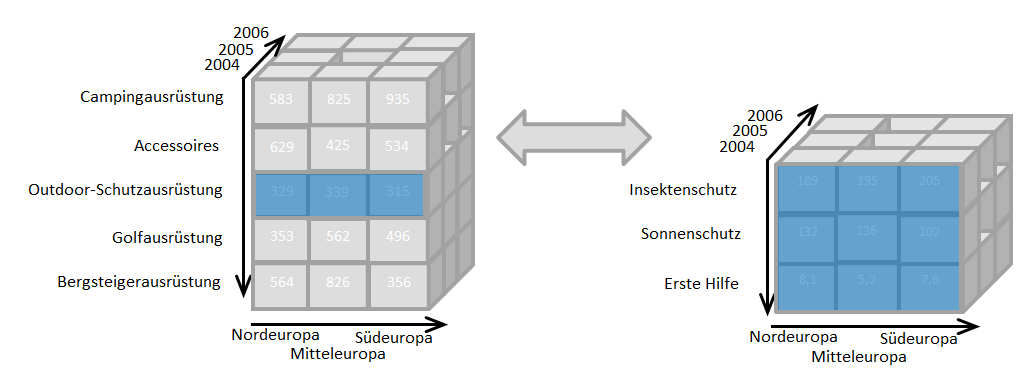
Finding the right filters
The goal of descriptive analysis is to find relevant combinations of objects, dimensions and measured values and to prepare them visually. In this step ‘Big Data’ becomes ‘Smart Data’. The goal is to create data sets that are ideally tailored to the user context. The managing director of a global fashion chain is not particularly interested in the throughput of a warehouse zone, but the plant manager is. Both stakeholders have access to both views via the data model, at least in theory, because the information is not generated but merely filtered.
Who benefits from descriptive analysis in intralogistics
The simple answer is: “Everyone who wants to optimize their business processes.” However, as with all data evaluations, statistical principles should be taken into account. After ten events, it may be possible to identify patterns, but similar to a survey of only ten people, the result is not reliable. The more data and the shorter the time periods, the faster it is possible to identify where optimization potential exists and what – still – is beyond one’s control, for example, reduced performance due to rain. This scenario is discussed in the following articles on ‘Diagnostic Analytics’, ‘Predictive Analyitcs’ and ‘Prescriptive Analytics’.
Source teaser image: M. B. M.
To the article overview
To our TUP series KI
Back to the home page